Executive Summary
Company Type
Mid-market B2B advisory firm
Primary Stakeholder
VP Marketing / CMO
Average Deal Size
$150,000+
Traffic Channels
LinkedIn + Search
Intervention
Landing-page + form + CTA path restructuring
Implementation Window
14 days
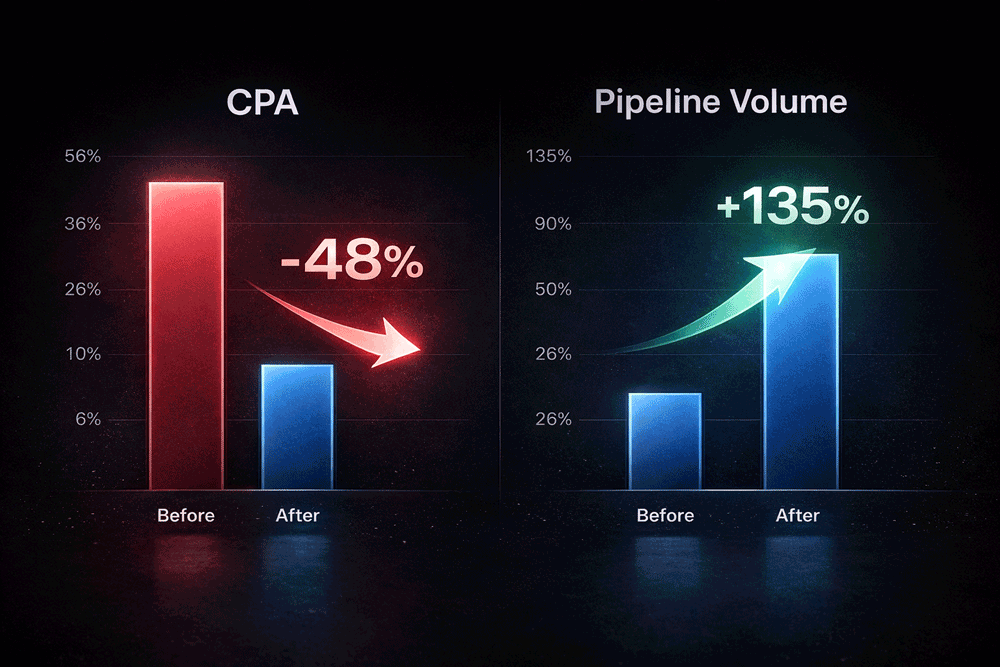
Before vs After Snapshot (45-Day Comparison)
Cost Per Acquisition
$4,500 $2,340
Qualified Consultations
22 52
Directional Pipeline Value
$3.3M $7.8M
Measurement Notes
- Comparison window: 45 days before vs 45 days after implementation.
- Primary KPI: qualified consultation requests.
- No changes to media budget, targeting, or ad creative during the lift window.
- Existing CMS and CRM routing remained unchanged.
- Intervention focused on page structure, proof hierarchy, CTA clarity, and form friction.
Metric Definitions
- CPA: ad spend / qualified consultation requests.
- Qualified Consultation: a booked consultation that met the sales team’s qualification criteria.
- Pipeline Value: directional estimate based on qualified consult volume × average active opportunity value.
- Note: revenue and pipeline figures shown are directional, not audited closed-won revenue.
What Changed - and What Did Not
We changed the information hierarchy, trust placement, CTA architecture, and lead-capture flow. We did not change media spend, campaign targeting, ad creative, CMS, or CRM routing during the observed lift period.
The Business Problem
Strong traffic quality. Weak conversion economics.
The marketing team was already attracting the right audience. Paid acquisition was generating relevant executive traffic across search and LinkedIn, and cost-per-click was within an acceptable range.
The problem was downstream: too little of that high-intent traffic was turning into qualified sales conversations. For a marketing leader accountable for pipeline efficiency, that creates a serious disconnect between campaign performance reports and actual revenue contribution.
“Traffic quality was not the issue. Conversion friction was.”
At a $60,000 monthly paid-acquisition budget, even modest structural friction compounds quickly. Instead of scaling a reliable funnel, the business was scaling waste.
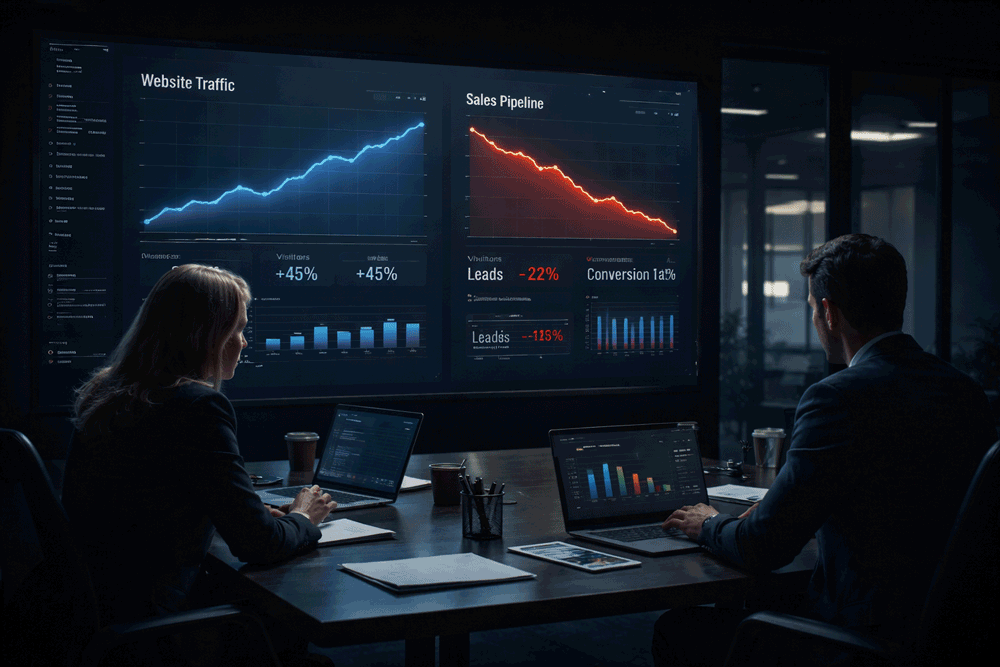
High-intent traffic was reaching the page, but the funnel was not converting efficiently.
Why a Full Redesign Was Not the Right First Move
The core issue was conversion structure, not brand cosmetics.
Before the audit, leadership was close to approving a large redesign initiative. But a full visual overhaul would have been expensive, slow, and risky if the real problem sat inside the conversion path itself.
Our recommendation was to pause any cosmetic redesign decision and evaluate the funnel mechanics first: message clarity, proof visibility, CTA competition, and form effort.
Diagnosis: Where the Funnel Was Losing Conversions
Specific friction points identified across landing, CTA, and form flow.
We reviewed the page experience through a conversion-friction lens, focusing on what a time-constrained B2B decision-maker needs to understand before committing to a consultation.
Diagnostic Focus Areas
Message clarity above the fold, trust visibility, CTA competition, form effort, and the transition from ad click to sales conversation.
| Funnel Step | Observed Friction | Primary Issue |
|---|---|---|
| Above-the-Fold Landing Experience | Weak early clarity | Core value proposition and proof were not visible quickly enough for executive readers. |
| CTA Decision Layer | Too many competing actions | Multiple CTA paths and navigation options diluted the primary conversion goal. |
| Lead Capture Form | High abandonment risk | The form asked for too much information too early, increasing hesitation before commitment. |
Important Note on Evidence
Replace generic illustrations with actual redacted “before” and “after” screenshots wherever possible. Executive buyers trust real artifacts more than conceptual visuals.
What We Changed
Implementation-ready fixes deployed in 14 days.
Rather than recommending a full redesign, we focused on high-impact structural changes that could be implemented quickly by the existing team.
Low-Disruption Deployment
The updated conversion path was deployed without changing the CMS, pausing campaigns, or disrupting CRM routing.
1. Reduced Form Friction
We simplified the initial conversion step and shifted heavier qualification questions later in the process, reducing hesitation at the first commitment point.
2. Moved Proof Higher
We brought stronger trust assets and commercial proof closer to the top of the page so decision-makers could validate credibility faster.
3. Clarified the Primary Conversion Path
We reduced competing actions and made the primary CTA more obvious, so the page supported one clear next step instead of multiple diluted ones.
Outcome After Deployment
Lower acquisition waste. Stronger qualified pipeline generation.
Once the funnel was restructured, paid traffic performed more efficiently. The same acquisition budget started producing more qualified consultation volume at a lower cost.
First measurable lift was observed within 10 days of deployment.
Observed Lift Conditions
During the measurement window, no changes were made to media spend, targeting, or ad creative. That strengthens the case that funnel changes were the primary driver of the observed lift.
-
More Efficient Acquisition CPA fell from $4,500 to $2,340, allowing the same media budget to generate more qualified opportunities.
-
Higher Qualified Consultation Volume The updated page structure and lower-friction capture flow increased the number of qualified consultations entering the pipeline.
-
Stronger Pipeline Yield Based on average opportunity value, the increase in qualified consult volume materially improved pipeline generation efficiency.
Leadership Takeaway
Strong paid acquisition can only do so much if the landing experience creates hesitation, confusion, or unnecessary effort. In this case, better conversion architecture improved performance without requiring more spend.
This case shows what happens when conversion friction is treated as a revenue problem, not just a design problem.
If your paid funnel is attracting the right traffic but not producing enough qualified pipeline, the issue may be structural - not promotional.
Impact Snapshot
-48%
Cost Per Acquisition
+135%
Qualified Consultation Requests
$0
Added to Monthly Ad Spend
14 Days
Implementation Window
What Happens in a Funnel Teardown
- • Step 1: Traffic-to-conversion path review
- • Step 2: Landing-page, CTA, and form-friction analysis
- • Step 3: Prioritized recommendations
- • Step 4: Implementation-ready direction for your team
Audit delivery typically within 5–7 working days
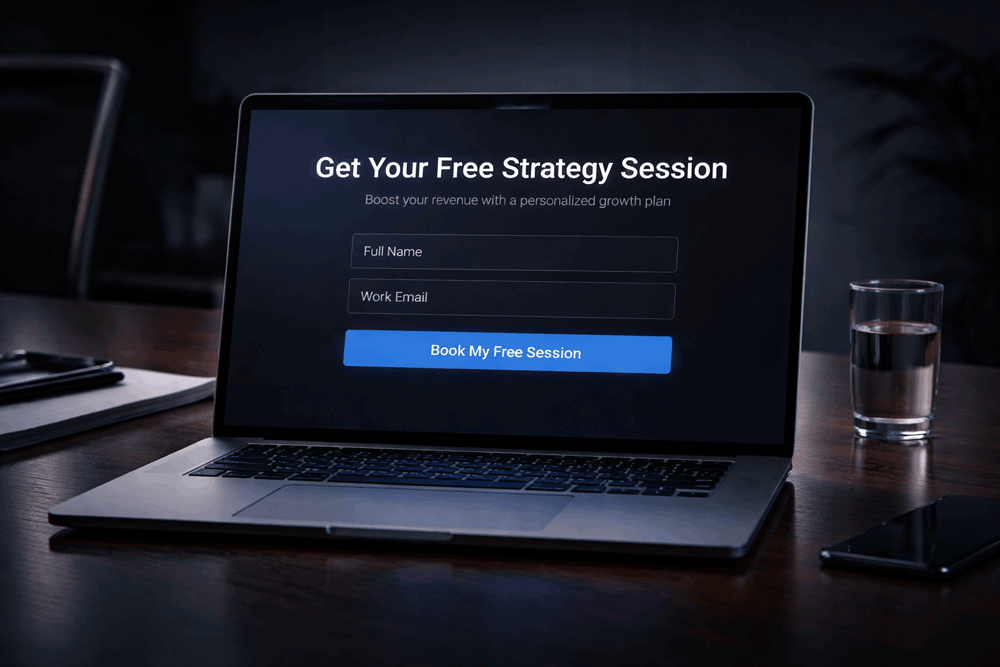
Book a Funnel Teardown
If your paid traffic is reaching the page but not producing enough qualified conversations, we’ll help identify the friction points most likely suppressing conversion.
Engagement Note
If we do not identify meaningful conversion friction during the review, we will tell you directly.
No forced retainer
✔ Landing-page, CTA, and form friction focus
Best fit for B2B teams spending $20k–$100k+/month on paid acquisition.
Book a Funnel TeardownNo generic audit decks.